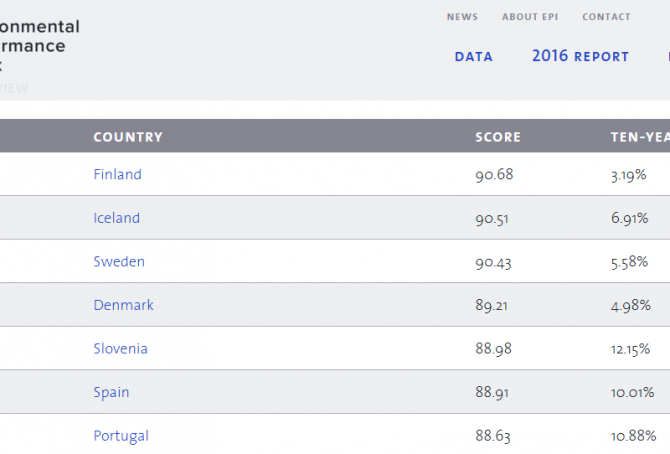
Environmental Performance Index 2016: Ranking of 180 countries
Every second year Yale and Colombia Universities, in collaboration with the World Economic Forum, publish an Environmental Performance Index (EPI) with global ranking. The 2016 edition with ‘Ranking of 180 countries‘ is now available – click on individual countries at the sourse to see more details on Biodiversity and Habitat, Forests, Climate and Energy, Fisheries, Agriculture, Water Resources, Water and Sanitation, Health Impacts and Air Quality. Scores are converted to a scale of 0 to 100, with 0 being the worst observed value and 100 the best. The seven best performing countries are ranked in the table (copied from the site).
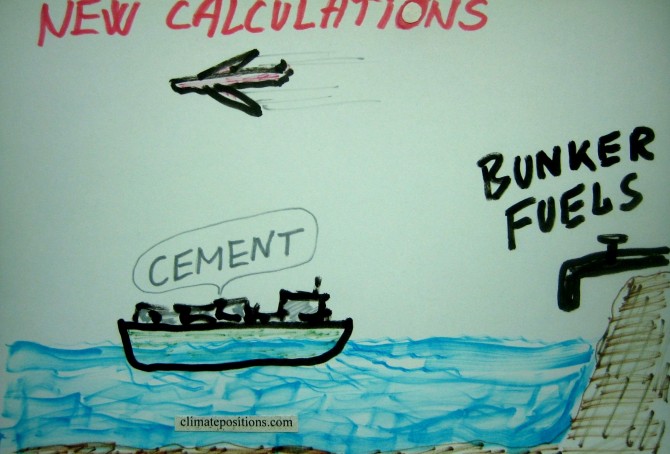
ClimatePositions: CO2 Emission-data now include cement production (and exclude bunker fuels)
So far, ‘EIA’ has been the source of national CO2 Emissions in ClimatePositions. EIA include emissions from burning of fossil fuel, including bunker fuels (fuels used for international aviation and maritime transport). Globally, bunker fuels account for about 3% of all fossil fuel CO2 Emissions.
By January 2016, the source of CO2 Emissions used in ClimatePositions switches to ‘Carbon Dioxide Information Analysis Center (CDIAC)’, or simply Global Carbon Project. CDIAC also include emissions from burning of fossil fuel, but exclude emissions from bunker fuels (fuels used for international aviation and maritime transport), and instead include ‘CO2 Emissions from cement production’. Emissions from cement production (and oxidation) amount to about 5% of all fossil fuel emissions, globally. The total annual national carbon emissions at the source are subsequently converted¹ to per capita CO2 Emissions for the use in ClimatePositions. Note that emissions 2012-2014 are preliminary estimates².
For comparison, the table below shows the national shares of the global Climate Debt, respectively, with CO2 Emission data from 1) Global Carbon Project (CDIAC) and 2) EIA. Countries with increased Climate Debt, relatively, due to the conversion of sources are marked in red. The global Climate Debt will only be slightly affected by the change (the global Climate Debt is 5.7 trillion by Januar 2016).
From today, Global Carbon Project will be used as source of CO2 Emissions in ClimatePositions. New rankings are available in the menu “Climate Debt”. More comments below the table.

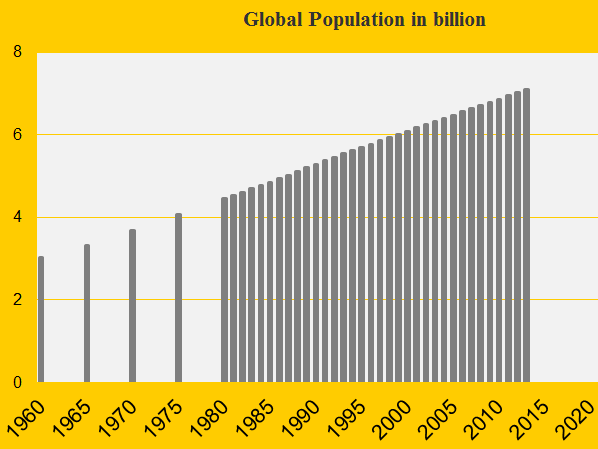
Update 2015: Global Population now 7.35 billion (life expectancy, births rates and an alarming prediction)
The estimated Global Population increased from 7.26 billion in 2014 to 7.35 billion in 2015 – an increase of 1.2%, or 87 million, in one year. See the population growth 1960-2015 in the diagram below. Some surprising demographic trends of life expectancy and births rates, and a long term Global Population prediction, are included.
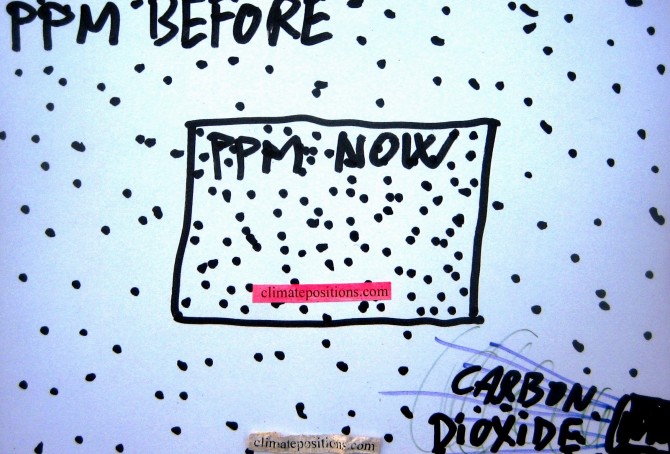
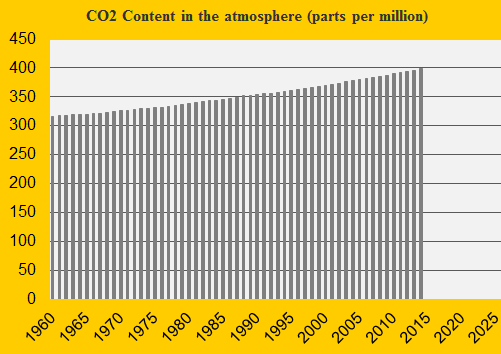
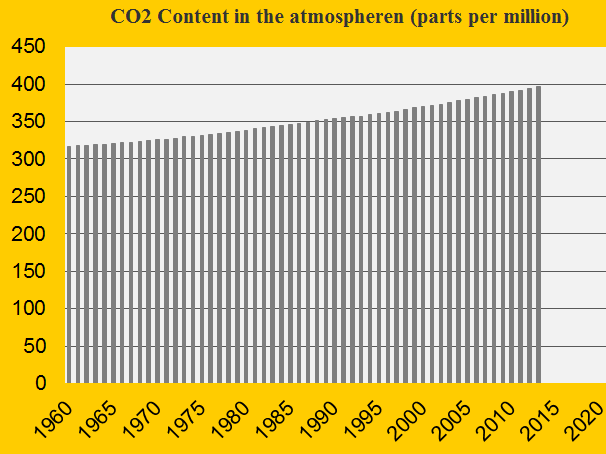
Update 2015: CO2 Content in the atmosphere has passed 400 ppm
The carbon dioxide content in the atmosphere passed 400 ppm (parts per million) in 2015 (mean). In 2014 the content was 398.61 ppm and in 2015 it was 400.83 ppm – the annually updated figure is used in ClimatePositions.
See the alarming development 1960-2015 in the diagram below. The pre-industrial level was below 300 ppm and 350 ppm is considered the relatively safe limit. Human-caused CO2 Emissions is the main cause of global warming, melting ice sheets, sea level rise and escalation of extreme weather events.
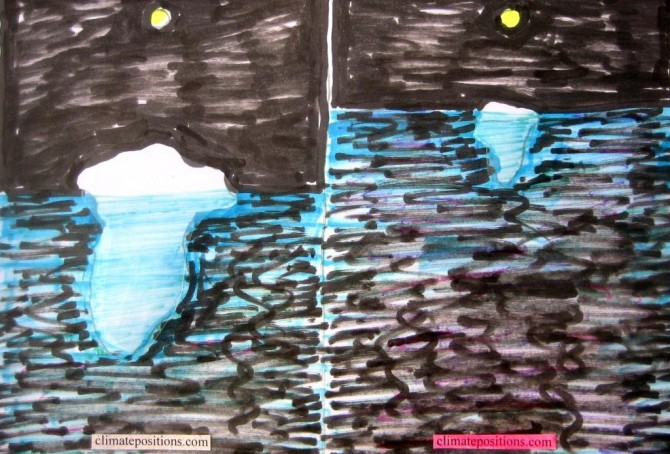
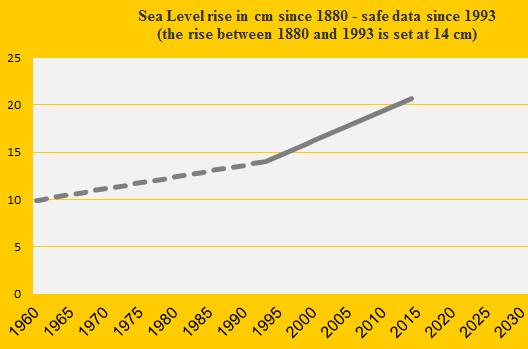
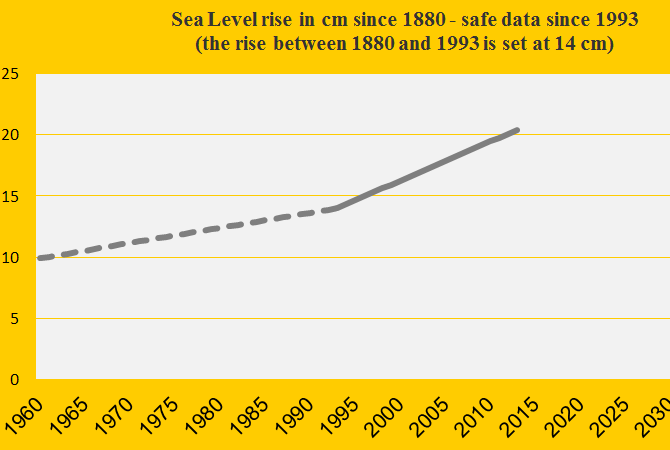
Update 2015: Sea Level rise slowly accelerates
During 2015 the average estimated rate of global Sea Level rise since 1993 increased from 3.2 mm (±0.4 mm) annually to 3.3 mm (±0.4 mm). This indicates a slowly continually accelerating rate of Sea Level rise. In ClimatePositions the Sea Level rise between 1880 and 1993 is set at 1.2 mm annually, or 14.00 cm in total, and combined this adds up to a total estimated Sea Level rise between 1880 and 2015 of 21.26 cm (this figure is used in ClimatePositions).
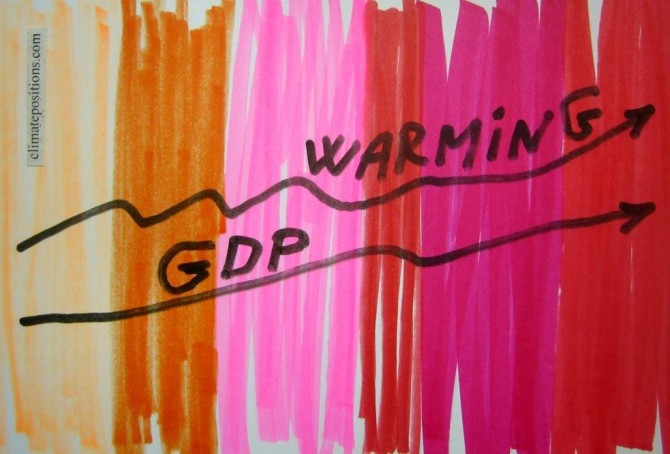
2014-updates of GDP(ppp-$) … rising along with the temperature
2015
The national Climate Debt in ClimatePositions increases with growing GDP(ppp-$)¹. 2014-updates of GDP from ‘World Bank’ are now available in ‘Calculation (Excel)’. The world’s average per capita GDP(ppp-$) grew from $14,417 in 2013 to $14,939 in 2014. The diagram below shows the development in GDP(ppp-$) in 2000-2014 of the world average and five of the world’s largest per capita fossil fuel CO2 Emitters (in 2012): Qatar (50.8 tons of CO2), United Arab Emirates (44.0 tons), Singapore (38.8 tons), Bahrain (25.8 tons) and Saudi Arabia (22.0 tons).

Update: Climate funding as share of Climate Debt, by country
2015
‘Climate Funds Update’ is an independent website providing information on climate finance designed for developing countries to address climate change. The data is based on information received from 25 multilateral, bilateral, regional and national climate funds and the funding is largely up to date by the end of June 2015. A total of $17 billion has currently been funded (money deposited), of which 96% is country-sourced¹. The updated table below shows the level of national climate financing to developing countries, as percentage of the accumulated Climate Debt. The values are based on the latest available updates.

Forest Cover updates 2015 (and the number of trees on the planet)
2015
The United Nations site for the ‘Millennium Development Goals Indicators’ (MDG Indicators) has published the estimated Forest Cover as percentage of land area of 225 countries. The table at the bottom includes only 83 selected countries with Climate Debt in ClimatePositions (the fraction of the Climate Debt caused by Forest Cover-change is revealed). However, Forest Cover alone is a poor ecosystem-indicator and therefore the area with the precious Primary Forests is also included in ClimatePositions (read the article ‘Forest Cover, Primary Forests and Climate Debt’).
Nuclear Power updates 2014
2015
The world’s Nuclear Power generation increased by 2.2% in 2014 compared to 2013. The six largest nuclear producers United States, France, Russia, South Korea, China and Canada increased generation by 4.0%, while the rest of the world reduced generation by 3.9%.
The same six Nuclear Power countries, representing 28% of the world’s population, are responsible for 54% of the global CO2 Emissions from fossil fuels and 60% of the global Climate Debt (see the ‘ranking’).
The last five years of generated global nuclear electricity was:

Polynomial projections of global warming 1880-2014 … 2130
2015
The global Land (air) Temperature of 2014 was the 4th warmest ever measured. Both the global Ocean (air) Temperature and the combined Ocean and Land Temperature of 2014 were the warmest ever measured (see ‘here‘).
A ‘polynomial projection’ (or polynomial interpolation) of temperature is neither a prediction nor a scientific scenario with certain assumptions. A polynomial projection reproduces data into the future in a sounder manner than a linear projection. The five diagrams below show the global Land (air) Temperature since 1880 with polynomial projections from 1980, 1990, 2000, 2010 and 2014 … projected by 2130. The red projection line start at 0°C in 1880 and the passing-years of 1°C, 2°C, 3°C etc. are marked. Read the comments below the diagrams.
Update 2014 of the CO2 Content in the atmosphere
2015
The CO2 Content in the atmosphere measured in ppm (parts per million) set a new record in 2014 (as in all years in decades). In 2013 the content was 396.48 ppm and in 2014 it was 398.55 ppm – this updated figure is used in ClimatePositions.
Sea Level update 2014
2015
The estimated global Sea Level increase rate is unchanged 0.32 cm annually since 1993. The increase between 1880 and 1993 is set at 14.00 cm. This adds up to a total Sea Level rise from 1880 to 2014 at 20.72 cm – this figure is used in ClimatePositions.
Ecological Footprint updates 2014 (152 countries)
2014
Recently ‘Living Planet Report 2014’ was released by WWF. In addition to the evaluation of the earth’s ecological condition the report of 180 pages presents a new ranking of 152 countries’ Ecological Footprint per capita (pdf p 157). See the ranking in ‘graphics’. The Ecological Footprint by country is calculated by ‘Global Footprint Network’ (in collaborations with governments in order to improve data and methodology¹).

Update of GDP(ppp-$) 2013
2014
The Climate Contributions (climate debt) in ClimatePositions increases with growing GDP(ppp-$)¹. The 2013 updates and adjustments back in time have now been released (see the ‘World Bank’). For some countries, this means large growth of GDP(ppp-$) since 2000 and thus large increases in Climate Contributions. In other words, the previous data tended to be too modest with respect to the wealth of many countries, in particular Iraq, Jordan, Indonesia, Kazakhstan and Egypt, and the rich authoritarian oil regimes Kuwait, Oman, Saudi Arabia and Qatar. The updated Climate Contributions per capita worldwide are available ‘here’ and in the spreadsheet in the menu ‘Calculations‘. See the Climate Contributions as a percentage of the annual GDP(ppp-$) ‘here‘.
Nuclear Power updates 2013
2014
The world’s Nuclear Power generation increased marginally in 2013 compared to 2012. The last four years of generated global nuclear electricity was:
- 2010: 2,629 billion kWh
- 2011: 2,516 billion kWh
- 2012: 2,346 billion kWh
- 2013: 2,359 billion kWh
Update 2013 of the CO2 Content in the atmosphere
2014
The CO2 Content in the atmosphere measured in ppm (parts per million) is skyrocketing because of the increase in human-caused emissions. In 2012 the content was 393.82 ppm and in 2013 it was 396.48 (this updated figure is used in ClimatePositions). Some scientists estimate that 350 ppm is the “safe” limit of CO2 in the atmosphere. See the development 1960-2013 in the diagram. This is the main cause of Global Warming, Climate Change (extreme weather phenomena) and rising Sea Level.
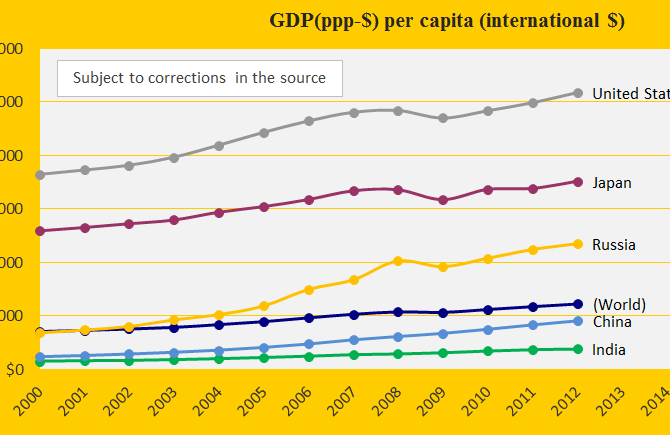
2012 update of GDP in ClimatePositions
2014
The annual national GDP(ppp-$) (standard of living measured by purchasing power) has a direct impact on the Climate Contributions. Updating of GDP for 2011 and 2012 are now entered ClimatePositions (Excel) and for most countries, this means considerable increases in the Climate Contribution (climate debt). In connection with the GDP update, a minor simplification of the calculation method has been made (recent years are still weighted more than previous years in GDP+).
The diagram shows the updated (and revised) GDP(ppp-$) 2000-2012 for the five largest CO2 Emitters: China, United States, Russia, India and Japan.

Global warming: Air Temperature update 2013
2014
2013 was the 4th warmest year recorded of land Air Temperature since measurements began in 1880. See the development 1960-2013 in the diagram (the average temperature rise in 1880-1937 is set at 0°C). The last ten years of average temperature rise is the figure used in ClimatePositions.
Global Population update 2013
2014
The growing Global Population puts additional pressure on the distressed nature (deforestation, pollution, declining biodiversity, etc.) and increases the total CO2 Emissions. From 2012 to 2013 the population is estimated to have increased from 7.02 to 7.09 billion – an increase of 77 million in one year. See the development 1960-2013 in the diagram.
Sea Level update 2013
2014
The measurements of global Sea Level are very complicated and end up in a single figure for average annual Sea Level rise since 1993. From 2012 to 2013, the increase rate is unchanged 0.32 cm annually (since 1993). The total increase between 1880 and 1993 is set at 14 cm (with uncertainty). This adds up to a total Sea Level rise from 1880 to 2013 at 20.40 cm – the figure used in ClimatePositions. See the development in Sea Level 1960-2013 in the diagram (the level in 1880 is set at 0).