My own climate change boycott country-list
2017
Without been fanatical about it, I seek to boycott the greediest and most climate-destructive countries on the planet. For the fairness, I have divided the fifteen nominees into two leagues:
A) Countries with per capita Climate Debts more than 10 times world average: Qatar, Kuwait, Brunei, Luxembourg, Trinidad and Tobago, United Arab Emirates and Oman.
B) Countries with per capita Climate Debts between 5 and 10 times world average: Saudi Arabia, United States, Bahrain, Australia, Norway, Equatorial Guinea, Canada and South Korea.
Feel free to copy…
Among the fifteen countries only Luxembourg and South Korea are not among the world’s twenty largest per capita Fossil Fuel producers (read the article: ‘How green are the fossil fuel producers? (Correlation between fossil fuel production, CO2 Emissions, GDP and Climate Debt)‘.
The table below shows some key data of the fifteen countries. The table is read like this: 1) Between 1990 and 1999 Qatar emitted 55.1 tons of CO2 from Fossil Fuels (without bunker) and cement, annually per capita, 2) Between 2000 and 2015 Qatar emitted 51.7 tons (the average Climate Debt Free Level¹ was 32.4 tons), and 3) Qatars GDP(ppp) per capita was $143,788 in 2015.
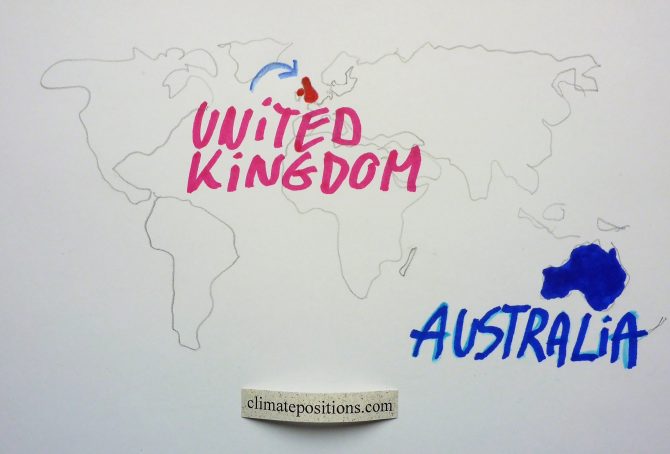
Climate change performance: The United Kingdom vs. Australia
2017
The United Kingdom and Australia and are the world’s 15th and 16th largest emitters of CO2 from Fossil Fuels and cement. Combined, the two countries were responsible for 2.2% of world CO2 Emissions in 2015. The following examines the ‘Indicators’ of CO2 Emissions, GDP(ppp-$) and Ecological Footprint (without carbon footprint).
The diagrams below show the per capita CO2 Emissions from Fossil Fuel (without bunkers) and cement, since 2000. The green bars show the Free Emission Level¹ – the exceedance is the basis for calculating the national Climate Debt.
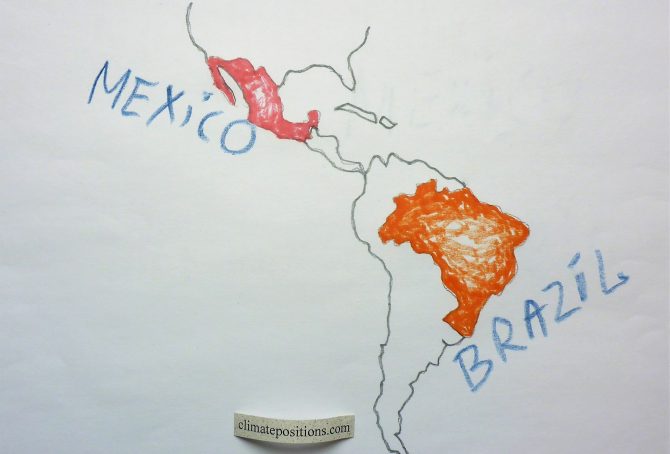
Climate change performance: Brazil vs. Mexico
2017
Brazil and Mexico are the world’s 11th and 12th largest emitters of CO2 from Fossil Fuels and cement. Combined, the two countries were responsible for 2.8% of world CO2 Emissions in 2015. The following examines the ‘Indicators‘ of CO2 Emissions, GDP(ppp-$), Forest Cover, Primary Forest and Ecological Footprint (without carbon footprint).
The diagrams below show the per capita CO2 Emissions from Fossil Fuel (without bunkers) and cement, since 2000. The green bars show the Free Emission Level¹ – the exceedance is the basis for calculating the national Climate Debt.
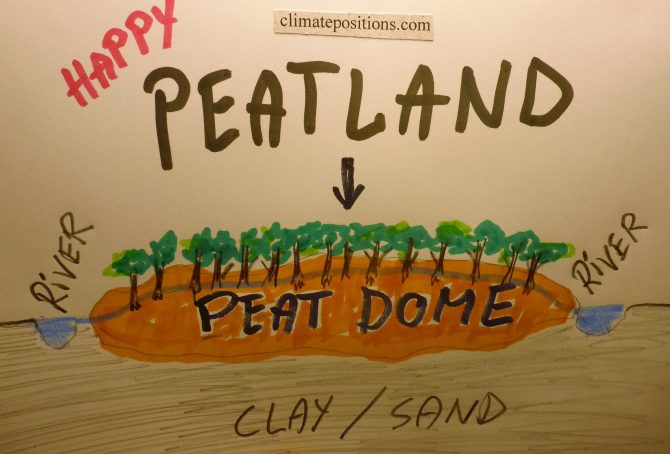
Climate change performance: South Korea vs. Indonesia (peatlands in Southeast Asia)
2017
In 2015 South Korea and Indonesia accounted for 3.60% and 0.51% of the global Climate Debt, respectively (see the ‘Ranking‘). The following examines the ‘Indicators‘ of CO2 Emissions, GDP(ppp-$), Forest Cover (and peatlands) and Primary Forest.
The first two diagrams show the per capita CO2 Emissions from Fossil Fuel (without bunkers) and cement, annually since 2000, of South Korea and Indonesia. The green bars show the Free Emission Level¹ – the exceedance is the basis for calculating the national Climate Debt. The world’s 9th and 10th largest CO2-emitters were responsible for 1.7% (South Korea) and 1.5% (Indonesia) of global emissions in 2015, respectively. South Korea’s per capita emissions were 11.7 tons in 2015 (preliminary), while Indonesia’s were 2.1 tons (preliminary), which was 2.2% above the 2014-level.
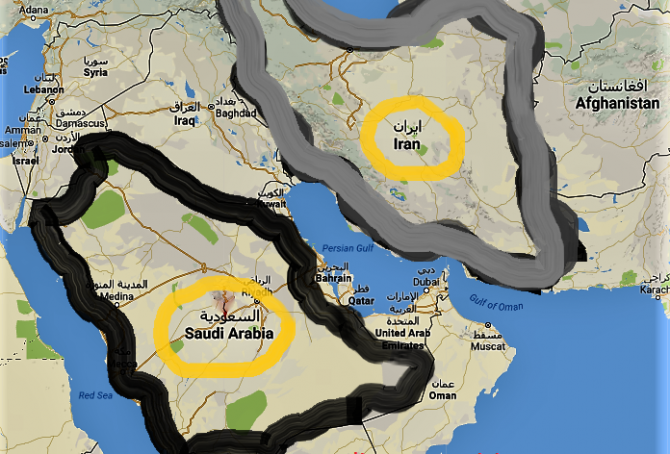
Climate change performance: Iran vs. Saudi Arabia (gas and oil)
2016
The large oil and gas producers Iran and Saudi Arabia are the world´s 7th and 8th largest emitters of CO2 from Fossil Fuels. The diagrams below show the per capita CO2 Emissions from Fossil Fuels (without bunkers) and cement, annually since 2000. The green bars show the Free Emission Level¹ – the exceedance is the basis for calculating the national Climate Debt. Iran and Saudi Arabia were responsible for 1.9% and 1.7% of global emissions in 2015.
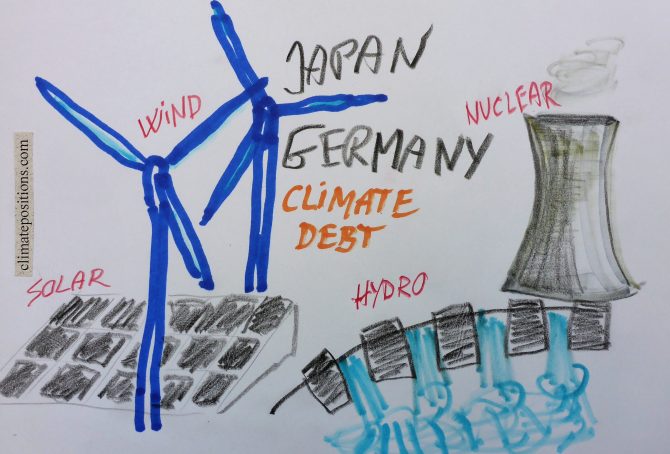
Climate change performance: Japan vs. Germany (Renewable Energy and Nuclear Power)
2016
The world’s 5th and 6th largest emitters of CO2 from Fossil Fuel (without bunkers) and cement Japan and Germany, were responsible for 3.4% and 2.1% of the global emissions in 2015. The diagrams below show the per capita CO2 Emissions, annually since 2000. The green bars show the Free Emission Level¹ – the exceedance is the basis for calculating the national Climate Debt.
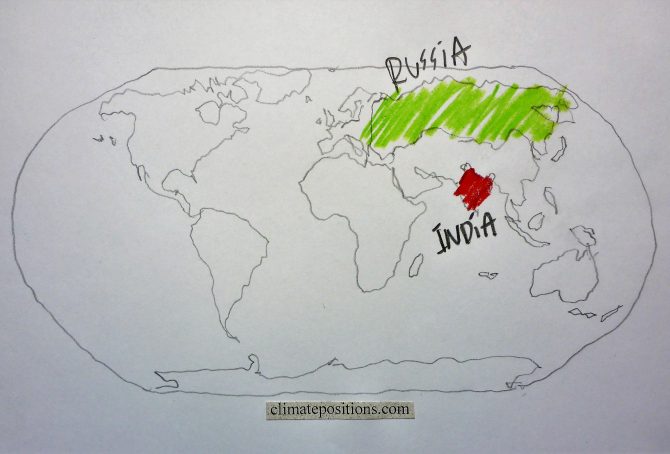
Climate change performance: India vs. Russia (CO2 Emissions from coal)
2016
The diagrams below show the per capita CO2 Emissions from Fossil Fuel (without bunkers) and cement, annually since 2000, of India and Russia. The green bars show the Free Emission Level¹ – the exceedance is the basis for calculating the national Climate Debt. The world’s 3rd and 4th largest CO2-emitters were responsible for 6.5% (India) and 4.9% (Russia) of global emissions in 2015. India’s per capita emissions were 1.7 tons in 2015 (preliminary), which was 4.0% above the 2014-level.

Climate change performance: China vs. the United States (wealth inequality)
2016
The diagrams below show the per capita CO2 Emissions from Fossil Fuel (without bunkers) and cement, annually since 2000, of China and the United States. The green bars show the Free Emission Level¹ – the exceedance is the basis for calculating the national Climate Debt. The world’s two largest CO2-emitters were responsible for 29% (China) and 15% of global emissions in 2015.
Apparently, China’s per capita emissions have peaked, while the moderate reduction-rate 2006-2012 of the United States, has flattened out.

Final Update 2015: new rankings of 159 countries’ Climate Debt, accumulated since 2000
2016
Every five year, since 2005, Final Updates of national Climate Debts are completed in ClimatePositions and 2015-updates¹ are now available in ‘Calculation (Excel)‘. New rankings in six categories, of 159 countries, are available in the menu “Climate Debt”. In the coming months, the climate change performances of selected countries will be analyzed in articles, starting with the United States and China.
The following illustrate Final Update 2015 in two ways: 1) The change of Climate Debt as percentage of the global Climate Debt, annually since 2000, of the 10 largest CO2 emitters, and 2) Key-figures of the United States.
The table below of the 10 largest CO2 emitters (representing 70% of the global emissions in 2015) shows the national shares of the global Climate Debt in 2015 and 2010. China, Russia and Saudi Arabia stand out with extremely harmful developments, while the United States still has by far the largest Climate Debt. See the latest ‘Ranking’ of 159 countries.

Indicator update: Ecological Footprint (Climate Debt of 15 additional small countries)
2016
The per capita Ecological Footprint¹ for 186 countries has been released for licensing by ‘Global Footprint Network’ (Public Data Package – Free Download). The total national Footprint without the weighty carbon Footprint² is used as an ‘Indicator’ in ClimatePositions. Now 15 additional small countries have full data and thus calculation of Climate Debt for the first time. The per capita Climate Debt of these countries are listed below. Brunei, Luxembourg and Equatorial Guinea enter top-ten of the worst performing countries among the previous 148 countries (see the ‘Ranking’ by January 2016).
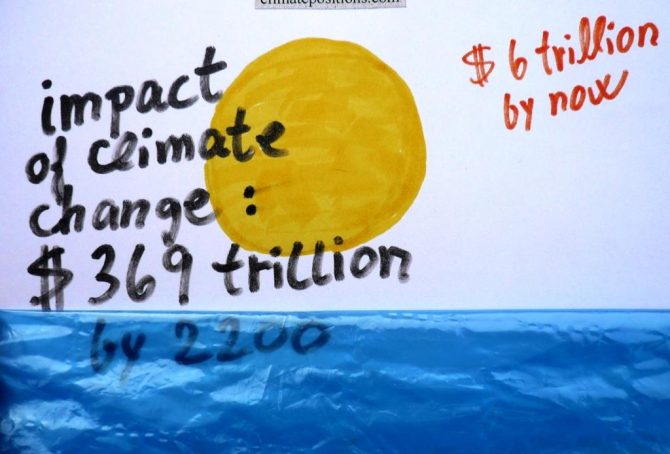
Predicted impact of climate change: $369 trillion by 2200 (study)
2016
Nobody knows how high the costs of global warming will be in the future. However, ‘Studies’ predict a total of $369 trillion by 2200, assuming that humans will have stopped emitting greenhouse gases from burning Fossil Fuels around 2100 and atmospheric CO2 concentrations will have reached 700 ppm. The calculations include accelerating release of methane from melting permafrost (13% of the total costs).
ClimatePositions calculates the ‘Climate Debt’, accumulated since 2000, for 148 countries with full data. The global Climate Debt amounted to $0.8 trillion in 2005, $2.6 trillion in 2010 and around $6.0 trillion in 2015 (preliminary estimate). The diagram below illustrates the accumulated Climate Debts (red dots) “smooth climbing” towards the predicted costs of $369 trillion by 2200 (black dot) … all speculatively of course!
Climate change performance of the United Kingdom in comparison with the European Union
2016
Given that the United Kingdom (UK) has decided to leave the European Union (EU), the following examines the development of CO2 Emissions, Ecological Footprint, GDP(ppp-$) and Climate Debt of the UK in comparison with EU.
Between 1860 and 1890 the UK was the world’s largest greenhouse gas emitter and as late as 1966 the UK was still the 4th largest emitter. See this ‘Interactive timeline of the world’s top 20 emitters‘. When it comes to CO2 Emissions from fossil fuels (without bunker fuels) and cement production the UK was the world’s 15th largest emitter in 2014 (preliminary).
Climate Debt: France ranks 35th among 148 countries
2016
France is responsible for 1.3% of the global Climate Debt of $5.7 trillion, accumulated since 2000. The French per capita Climate Debt by January 2016 was $1,148 which ‘Ranked’ France 35th among 148 countries, compared to 28th in 2010. Different rankings are available in the menu “Climate Debt”. The following examines the CO2 Emissions, Nuclear Power, Environmental Performance, GDP(ppp-$) and Climate Debt of France, in comparison with four countries with significant French-speaking populations: Canada, Belgium, Switzerland and Algeria.
The first diagram shows the French per capita CO2 Emissions from fossil fuels (without bunker fuels) and cement production in decades in comparison with the world average. CO2 Emissions since 2012 are preliminary estimates. From 6.2 tons in the 1990s the level decreased to 5.7 tons on average between 2000 and 2014 (preliminary). The green bars are the Contribution Free Level in ClimatePositions, determined by the level of emissions in the 1990s and a number of continuously updated ‘Indicators’.

Climate Debt: Ireland ranks 14th … however, with significant CO2 reductions over the last decade
2016
Ireland’s current Climate Debt is $2,704 per capita and the ‘Ranking’ by January 2016 was 14th among 148 countries. The following examines the Irish climate change performance in comparison with the United Kingdom, France, Canada and the United States.
The first diagram shows Ireland’s per capita CO2 Emissions from fossil fuels (without bunker fuels) and cement production in decades in comparison with the world average. CO2 Emissions since 2012 are preliminary estimates. From 9.4 tons emitted in the 1990s the level increased to 10.4 tons on average between 2000 and 2009 – and then dropped to 8.0 tons on average between 2010 and 2014 (preliminary). The green bars are the Contribution Free Level in ClimatePositions, determined by the level of emissions in the 1990s and a number of continuously updated ‘Indicators’.
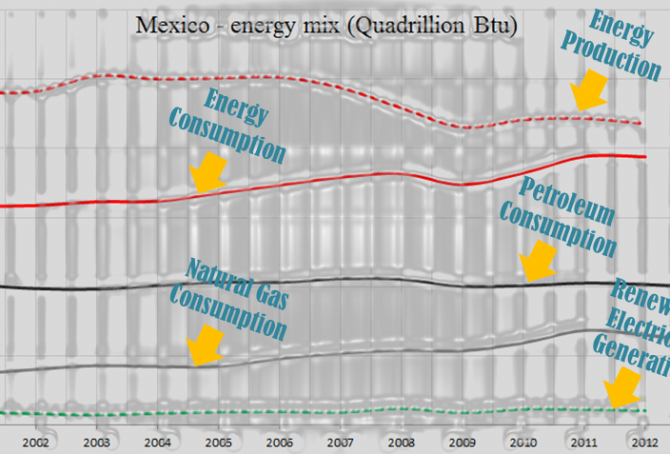
Mexico – the world’s 14th largest CO2 emitter (with an enormous solar potential)
Mexico’s current Climate Debt is $346 per capita and the ‘Ranking’ was 56th among 148 countries by January 2016. The following examines the Mexican CO2 Emissions, Climate Debt, Environmental Performance and GDP(ppp-$), in comparison with the United States, China, Brazil and Germany.
South Africa – the world’s 13th largest CO2 emitter (coal, coal and more coal … and inequality)
South Africa populates 0.7% of the planet’s people and emits 1.3% of the world’s CO2 from fossil fuels (without bunkers) and cement production. The Climate Debt of the 54 million South African’s amounts to $39 billion, or $720 per capita, and the ‘Ranking’ was 42nd among 148 countries by January 2016 – in 2010 the ranking was 45th.
The first diagram shows South Africa’s per capita CO2 Emissions from fossil fuels (without bunker fuels) and cement production in decades in comparison with the world average. CO2 Emissions 2012-2014 are preliminary estimates. The green bars are the Contribution Free Level, determined by the level of CO2 Emissions in the 1990s and a number of continuously updated ‘Indicators’.

Climate Debt: Finland ranks 13th among 148 countries
Finland’s current Climate Debt is $3,078 per capita and the ‘Ranking’ by January 2016 was 13th among 148 countries, compared to 10th ranked in 2010. The following examines the Finnish CO2 Emissions, Nuclear Power, Forest Cover, Environmental Performance and GDP(ppp-$), in comparison with the four largest trade partners Russia, Germany, Sweden and United Kingdom.

Climate Debt: Bahrain ranks 12th (immigrant workers reduce per capita CO2 Emissions)
Bahrain’s current Climate Debt, accumulated since 2000, is $3,352 per capita. The ‘Ranking’ by January 2016 was 12th among 148 countries. Although the total Bahraini CO2 Emissions from fossil fuels and cement production have increased about 100% since 1990, and 35% since 2006, the per capita emissions have declined from 27.2 tons in the 1990s to 17.9 tons in 2011 – how can that be?
The key explanation is simple: immigration of great numbers of (often) ‘Slavery-like workers‘, presumably with low individual emissions, has lowered the national average! Today around 55% of Bahrain’s population are immigrants from India, Bangladesh, Pakistan, the Philippines, Indonesia, Jordan, Syria, Yemen, Nepal, East Africa etc. If the immigrant-emissions hypothetically is set at 2 tons of CO2 per capita on average (which is more than their origin countries on average), then the 45% native Bahraini’s emitted 38 tons per capita in 2011, or eight times the world average. Nevertheless, the national ‘COP21 Submission 2015’ mentions no overall emission reduction target. Add to this the nasty facts that Bahrain’s fossil fuel production 2012 (Btu) was 44% above the 2000-level¹ and renewable electricity production (Btu) 2012 amounted only 0.003% of the total energy consumption (Btu). Bahrain is categorized as “authoritarian” and ranks 146 among 160 countries in the ‘Democracy Index 2015‘ … and no data is available on income distribution (inequality) – no surprise.
Indonesia’s Climate Debt, rainforests, waters and greenhouse gas emissions
Indonesia’s current Climate Debt, accumulated since 2000, is $123 per capita (‘ranks’ 67th among 148 countries, by January 2016). The total Climate Debt is $31 billion (‘ranks’ 25th). However, looking at the entire level of greenhouse gas emissions, Indonesia is estimated to be the world’s 3rd largest emitter¹, with the large majority of its emissions coming from rainforest and peatland degradation and loss. Today, around 5% of the global greenhouse gas emissions are coming from Indonesia, with its 3.7% share of the global population. The following examines the indicators of CO2 Emissions, Forest Cover, Primary Forests and GDP(ppp-$), and other warming-related topics such as forest fires, oil palms and ecosystems.

Forest Cover and Primary Forests 1990-2015 (two country groups are examined)
This article is sourced from two publications by ‘FAO’: ‘Forest Ecology and Management 2015 (pdf 145 p)’ and ’Global Forest Resources Assessment 2015 (pdf 253 p)’. The latter contains 46 different tables¹ with 234 countries and territories forest development 1990-2015.
Primary Forest is defined as naturally regenerated forest of native species, where there are no clearly visible indications of human activities and the ecological processes are not significantly disturbed. Today, Primary forest accounts for 32% of global Forest Cover and has apparently increased by around 6.8% between 1990 and 2015, however, this increase is largely due to the fact that more countries have submitted data for the statistic. This taken into account, an overall global Primary Forest loss of 2.5%, since 1990, is more likely (and 10.0% loss in the tropics).