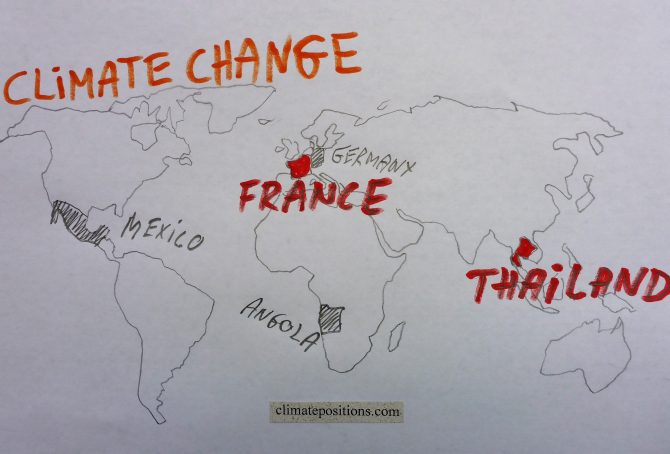
Climate change performance: Thailand vs. France
2017
Thailand and France are the world’s 19th and 20th largest emitters of CO2 from Fossil Fuels and cement. Combined, the two countries were responsible for 1.8% of world CO2 Emissions in 2015. The following examines the ‘Indicators‘ of CO2 Emissions, GDP(ppp-$), Ecological Footprint, Forest Cover and Nuclear Power.
The diagrams below show the per capita CO2 Emissions from Fossil Fuel (without bunkers) and cement, since 2000. The green bars show the Free Emission Level¹ – the exceedance is the basis for calculating the national Climate Debt.
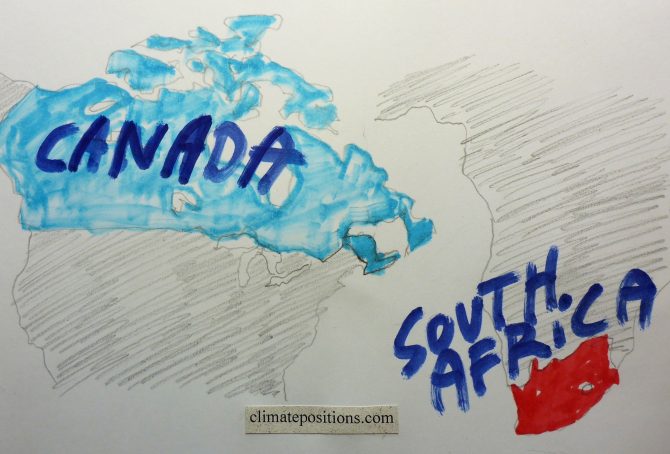
Climate change performance: Canada vs. South Africa
2017
Canada and South Africa are the world’s 13th and 14th largest emitters of CO2 from Fossil Fuels and cement. Combined, the two countries were responsible for 2.6% of world CO2 Emissions in 2015. The following examines the ‘Indicators‘ of CO2 Emissions, GDP(ppp-$), Ecological Footprint and Nuclear Power.
The diagrams below show the per capita CO2 Emissions from Fossil Fuel (without bunkers) and cement, since 2000. The green bars show the Free Emission Level¹ – the exceedance is the basis for calculating the national Climate Debt. Canada’s emissions from coal decreased by 41.3% between 2000 and 2014 (coal caused 13% of the CO2 Emissions from Fossil Fuels in 2014). South Africa’s emissions from coal increased by 6.4% between 2010 and 2014 (coal caused 83% of the CO2 Emissions from Fossil Fuels in 2014).
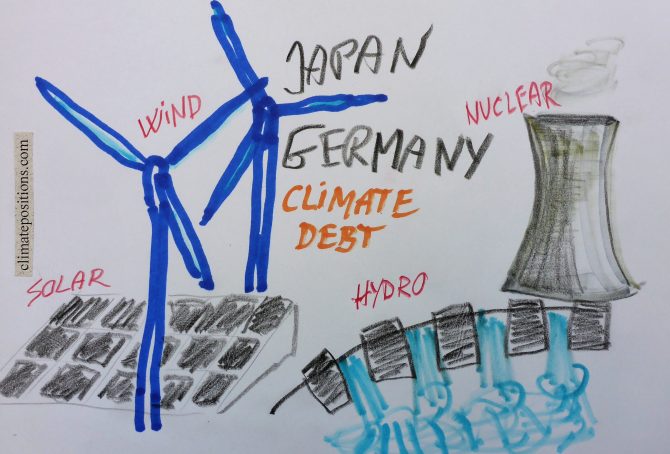
Climate change performance: Japan vs. Germany (Renewable Energy and Nuclear Power)
2016
The world’s 5th and 6th largest emitters of CO2 from Fossil Fuel (without bunkers) and cement Japan and Germany, were responsible for 3.4% and 2.1% of the global emissions in 2015. The diagrams below show the per capita CO2 Emissions, annually since 2000. The green bars show the Free Emission Level¹ – the exceedance is the basis for calculating the national Climate Debt.

Climate change performance: China vs. the United States (wealth inequality)
2016
The diagrams below show the per capita CO2 Emissions from Fossil Fuel (without bunkers) and cement, annually since 2000, of China and the United States. The green bars show the Free Emission Level¹ – the exceedance is the basis for calculating the national Climate Debt. The world’s two largest CO2-emitters were responsible for 29% (China) and 15% of global emissions in 2015.
Apparently, China’s per capita emissions have peaked, while the moderate reduction-rate 2006-2012 of the United States, has flattened out.
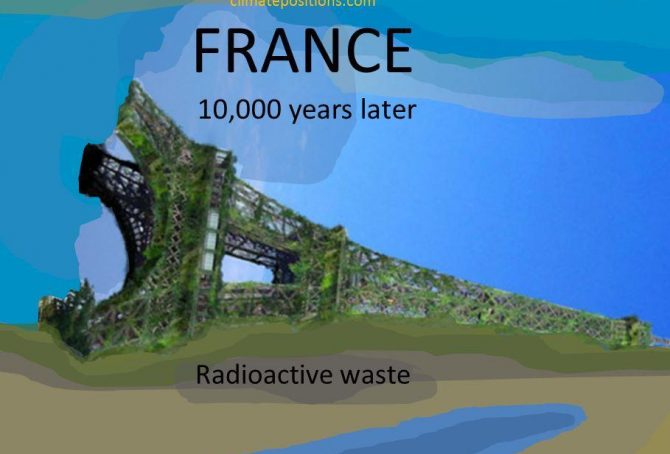
Climate Debt: France ranks 35th among 148 countries
2016
France is responsible for 1.3% of the global Climate Debt of $5.7 trillion, accumulated since 2000. The French per capita Climate Debt by January 2016 was $1,148 which ‘Ranked’ France 35th among 148 countries, compared to 28th in 2010. Different rankings are available in the menu “Climate Debt”. The following examines the CO2 Emissions, Nuclear Power, Environmental Performance, GDP(ppp-$) and Climate Debt of France, in comparison with four countries with significant French-speaking populations: Canada, Belgium, Switzerland and Algeria.
The first diagram shows the French per capita CO2 Emissions from fossil fuels (without bunker fuels) and cement production in decades in comparison with the world average. CO2 Emissions since 2012 are preliminary estimates. From 6.2 tons in the 1990s the level decreased to 5.7 tons on average between 2000 and 2014 (preliminary). The green bars are the Contribution Free Level in ClimatePositions, determined by the level of emissions in the 1990s and a number of continuously updated ‘Indicators’.

Climate Debt: Finland ranks 13th among 148 countries
Finland’s current Climate Debt is $3,078 per capita and the ‘Ranking’ by January 2016 was 13th among 148 countries, compared to 10th ranked in 2010. The following examines the Finnish CO2 Emissions, Nuclear Power, Forest Cover, Environmental Performance and GDP(ppp-$), in comparison with the four largest trade partners Russia, Germany, Sweden and United Kingdom.
World’s Nuclear Power generation 2015: 1.3% growth compared to 2014
The world’s Nuclear Power generation increased by 1.3% in 2015 compared to 2014 (and 4.0% increase compared to 2012). The table below shows the generation in billion kWh of all Nuclear Power nations and the global generation, since 2010. China increased the generation by 30.2% in 2015 compared to 2014, while the rest of the world the decreased the generation by 0.3%. The global generation level in 2015 is still 7.1% below the 2010-level.
Climate Debt of Germany & the European Union … versus the United States, China, Japan and Russia
The Climate Debt of ‘the 28 member states of the European Union (EU-28)’, China, the United States, Japan and Russia, combined, amounts to nearly 70% of the world’s total Climate Debt of around $5,700 billion. The following compares 1) EU-28 with the four countries, 2) Germany with EU-28, and 3) Germany with the four other countries.
The table below shows the per capita Climate Debt, the total Climate Debt and the share of the global Climate Debt, of EU-28¹, China, the United States, Japan and Russia. Rankings of 148 countries by 2010 and January 2016 (preliminary estimates) are available in the menu “Climate Debt”.

Climate Debt: South Korea now ranks 11th (Nuclear Power generation worsens the trend)
South Korea is responsible for 3.9% of the global Climate Debt of $5.7 trillion, accumulated since 2000. The per capita Climate Debt is $4,404 which ‘Ranks’ South Korea 11th among 148 countries, compared to 12th in 2010. Rankings are available in the menu “Climate Debt”. The following examines the CO2 Emissions, Nuclear Power, GDP(ppp-$) and Climate Debt, in comparison with four other large Nuclear Power generators.
The first diagram shows the South Korean per capita CO2 Emissions from fossil fuels (without bunker fuels) and cement production in decades in comparison with the world average. CO2 Emissions since 2012 are preliminary estimates. From 7.6 tons in the 1990s the level increased to 11.8 tons on average between 2000 and 2014 (preliminary). The green bars are the Climate Debt Free Level in ClimatePositions, determined by the level of emissions in the 1990s and a number of continuously updated ‘Indicators’.
Russia’s Climate Debt keeps accelerating (however, the Environmental Performance has improved)
The accumulated Russian per capita Climate Debt is ranked 25th among 148 countries. Back in 2010 the ranking was 33rd. The reckless development also shows in Russia’s share of the global Climate Debt: 3.9% by January 2016 compared to 3.0% in 2010. Rankings are available in the menu “Climate Debt”. The following examines the development of CO2 Emissions, Environmental Performance, GDP(ppp-$) and Climate Debt, in comparison with some of ‘Russia’s largest trading partners’.

Climate Debt: The United Arab Emirates ranks 4th (climate destruction branded by sports!) … soon with Nuclear Power
The per capita Climate Debt of the United Arab Emirates (UAE), accumulated since 2000, is $11,865, which ranks the rich oil-state 4th among 148 countries (see the ‘Ranking‘ by January 2016). Before proceeding, read these ten pinpoints of the intolerable situation:
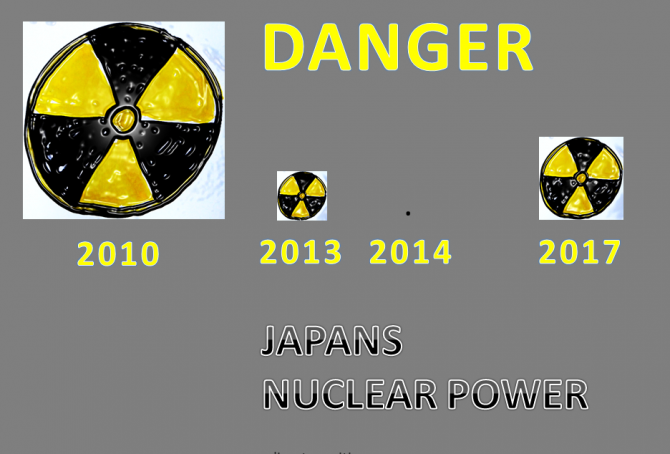
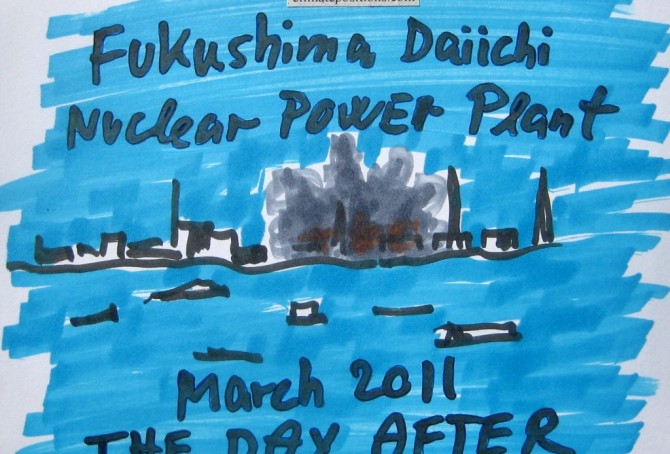
Japans Climate Debt after the Nuclear Power shutdown
In 2010 near 27% of Japans electricity supply was generated by Nuclear Power – in 2012, shortly after the Fukushima nuclear disaster in 2011, the percentage was below 2%. How did Japan respond to this energy shock and how did it influence the Climate Debt in ClimatePositions? The following examines the Nuclear Power (and electric energy mix), CO2 Emissions, GDP(ppp-$) and Climate Debt.
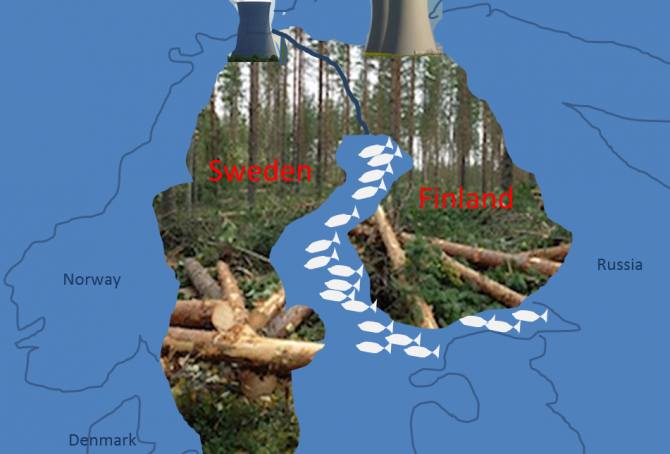
Sweden beats Finland in climate change performance
2015
Finland’s updated Climate Debt is $2,624 per capita and Sweden’s is $1,003. The ‘2014-rankings’ were 18th and 37th among 147 countries. The following examines the indicators of CO2 Emissions from fossil fuels, Nuclear Power, GDP(ppp-$), Climate Debt as a percentage of GDP(ppp-$) and Forest Cover.

Climate change performance of Austria, Czech Republic and Switzerland
2015
0.4% of the global population lives in Austria, Czech Republic or Switzerland and together they emitted 0.6% of the global CO2 from fossil fuels in 2012 – the joint share of the global Climate Debt is 0.7%. Austria’s updated Climate Debt per capita is $2,400 (ranked 19th), Czech Republic’s is $1,137 (ranked 34th) and Switzerland’s is $969 (ranked 38th). See the ‘ranking’. The following examines the Climate Debt trends and the indicators of CO2 Emissions (carbon dioxide from fossil fuels), Nuclear Power, Environmental Performance, GDP(ppp-$) and Climate Debt as a percentage of GDP(ppp-$).
Nuclear Power updates 2014
2015
The world’s Nuclear Power generation increased by 2.2% in 2014 compared to 2013. The six largest nuclear producers United States, France, Russia, South Korea, China and Canada increased generation by 4.0%, while the rest of the world reduced generation by 3.9%.
The same six Nuclear Power countries, representing 28% of the world’s population, are responsible for 54% of the global CO2 Emissions from fossil fuels and 60% of the global Climate Debt (see the ‘ranking’).
The last five years of generated global nuclear electricity was:
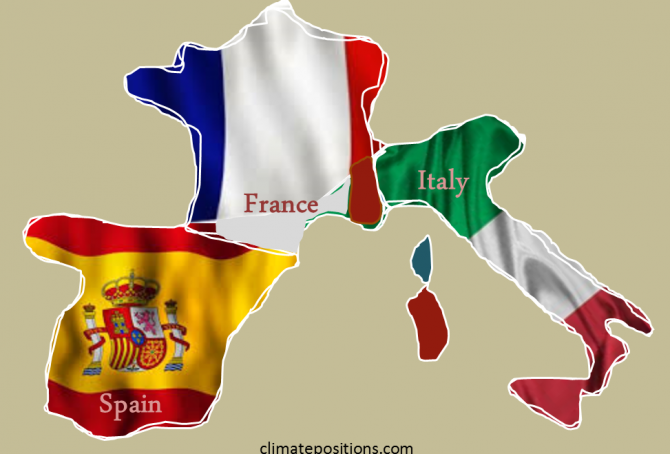
Climate change performance of Spain, France and Italy
2015
2.5% of the global population live in Spain, France or Italy and together they emitted 3.3% of the global CO2 from fossil fuels in 2012 – the combined share of the global Climate Debt is 4.3%. Spain’s updated Climate Debt per capita is $1,692 (ranked 25th), France’s is $1,352 (ranked 31st) and Italy’s is $1,034 (ranked 35th). See the ‘ranking’. The following examines the Climate Debt trends and the indicators of CO2 Emissions (carbon dioxide from fossil fuels), GDP(ppp-$), Forests, Marine Protection and Nuclear Power.
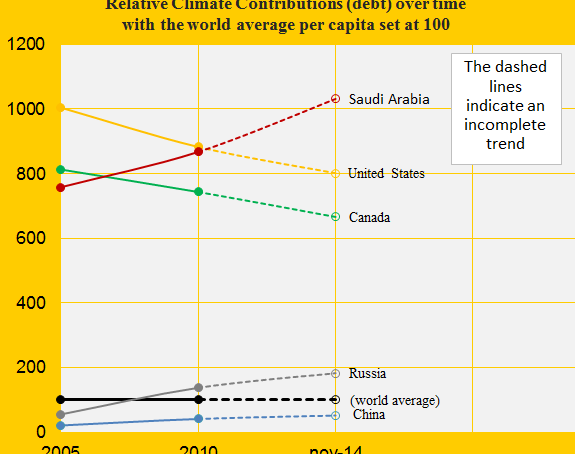
Climate change performance of Saudi Arabia and Canada
2014
The first diagram shows the relative Climate Contribution (debt) per capita of Saudi Arabia, Canada, China, the United States and Russia, with the world’s average set at 100. Around 2007 Saudi Arabia passed Canada and since then, the gap has grown considerably. Today, the climate debt per capita accumulated since 2000 are respectively $7,936 and $5,128 (see the ‘ranking’).
The Climate Contributions are calculated by using eleven ‘indicators’ of which national CO2 Emissions from the burning of fossil fuels is the principal. Extraction and export of fossil fuels is not one of the indicators which Saudi Arabia should be thankful for – wealth measured as ‘GDP(ppp-$)‘, however, is an indicator.

The United Kingdom beats Germany in climate change performance
2014
Germany is ranked 24th and United Kingdom 33rd among 147 countries on the list of the worst performing countries in ClimatePositions. See the ‘ranking’. The German Climate Contribution (debt) accumulated since 2000 has increased from $980 per capita in 2010 to $1,640 in the latest calculation, while the one of the United Kingdom has increased from $796 to $1,156. The first diagram shows the relative climate debt of the two countries in comparison with France, Italy and Poland, with the world average set at 100. Since 2010, the United Kingdom is the only country among the five that has improved significantly. The world average climate debt has increased from $455 per capita in 2010 to $769 in the latest calculation (this increase reflects both the growing CO2 Emissions from fossil fuels and the growing economy). The following analyses some trends for Germany and the United Kingdom.
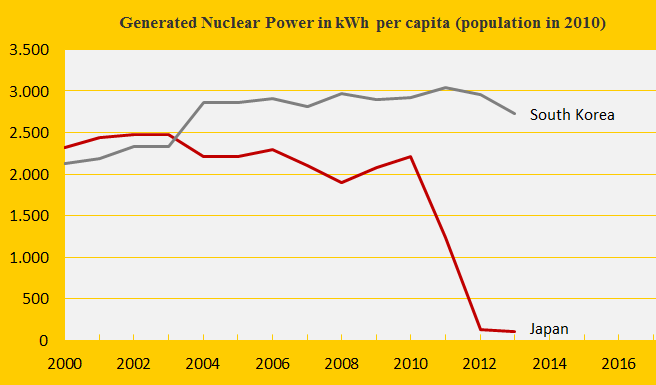
Climate change performance: Japan vs. South Korea
2014
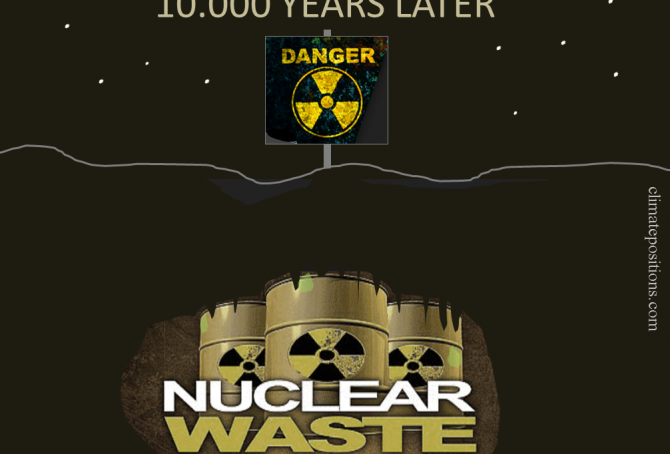
The first diagram shows the nuclear power generation per capita of the two countries. The Fukushima nuclear disaster in Japan in 2011 has caused a remarkable shutdown of generation – while CO2 Emissions from the burning of petroleum, coal and natural gas have increased (from 2011 to 2012 respectively by 6%, 5% and 3%) to close the energy gap. Nuclear power generation produce dangerous radioactive waste to deal with for thousands of future generations (10,000 to 250,000 years) and in ClimatePositions nuclear power is not accepted as a national CO2 Emission reduction instrument (read ‘more’). The following analyzes the indicator trends of Japan and South Korea.
Nuclear Power updates 2013
2014
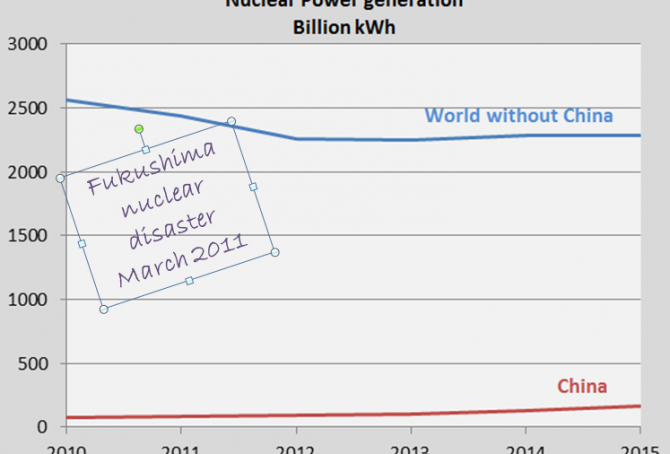
The world’s Nuclear Power generation increased marginally in 2013 compared to 2012. The last four years of generated global nuclear electricity was:
- 2010: 2,629 billion kWh
- 2011: 2,516 billion kWh
- 2012: 2,346 billion kWh
- 2013: 2,359 billion kWh